Air pollution has become one of the biggest environmental and public-health problems facing modern cities. Traffic, factories, construction, fuel burning and dust can fill the air with microscopic particles that are small enough to travel deep into the lungs and, in the case of PM2.5, even enter the bloodstream.
This ranking uses the latest complete annual data from the 2025 World Air Quality Report rather than live AQI readings, which can change from hour to hour. The cities are ranked by annual average PM2.5 concentration. For comparison, the World Health Organization’s annual guideline for PM2.5 is just 5 micrograms per cubic metre.
So, let’s check out the Top 10 Most Polluted Cities in the World and see where air pollution reached its most extreme levels and what is driving the problem.
1. Loni, India – 112.5 µg/m³
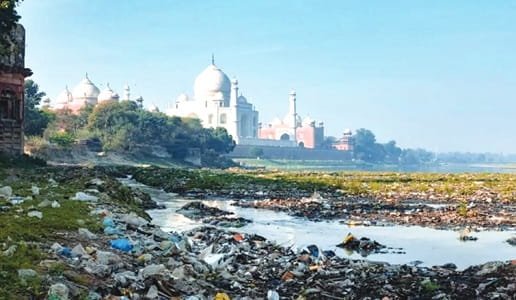
Loni, a densely populated town in Uttar Pradesh on the edge of the Delhi National Capital Region, recorded the world’s highest annual average PM2.5 level in 2025 at 112.5 micrograms per cubic metre. That is more than 22 times the WHO annual guideline.
Its pollution problem is closely connected with the wider Delhi-NCR airshed. Resuspended road dust, construction activity, traffic, local combustion and dry seasonal conditions all contribute to heavy particulate levels. The surrounding region also contains extensive industry and rapidly expanding urban development.
Winter makes conditions especially difficult because colder, calmer air can trap pollution close to the ground. Loni’s rise to No. 1 shows that the air-quality crisis around Delhi is no longer limited to the central capital area but extends deep into surrounding towns and industrial corridors.
2. Hotan, China – 109.6 µg/m³
Hotan in China’s Xinjiang region recorded an annual PM2.5 concentration of 109.6 micrograms per cubic metre in 2025, placing it second in the world.
Unlike many polluted megacities, Hotan’s problem is strongly influenced by geography. The city lies on the southern edge of the Taklamakan Desert, one of the world’s great sources of mineral dust. Powerful dust and sandstorms can carry enormous quantities of particles into the atmosphere, while the enclosed Tarim Basin can make dispersal difficult.
Human activity adds another layer. Industry, vehicles and urban combustion contribute to haze during periods when dust is not dominant. Hotan is therefore a striking example of a city where severe natural dust exposure combines with man-made emissions to produce extremely high annual particulate concentrations.
3. Byrnihat, India – 101.1 µg/m³
Byrnihat, on the Assam-Meghalaya border in northeast India, recorded 101.1 micrograms of PM2.5 per cubic metre in 2025. Although that was an improvement from the extraordinary levels recorded the previous year, it still ranked third globally.
The town has developed into an industrial hub containing or surrounded by cement, coke, ferro-alloy, steel, distillation and brick-related operations. Heavy trucks move through the area, while unpaved surfaces, construction, road dust, waste burning and the use of wood for cooking and heating can add to particulate pollution.
Topography also matters. Byrnihat sits in terrain that can limit the movement of polluted air. Its case is especially serious because bad air is not simply a short winter event; residents can face elevated pollution across much of the year.
4. Delhi, India – 99.6 µg/m³
Delhi recorded an annual average PM2.5 concentration of 99.6 micrograms per cubic metre in 2025, keeping it among the world’s most polluted urban areas. The figure is almost 20 times the WHO annual guideline.
No single source explains Delhi’s air. Vehicles are a major local contributor, while industry, construction, road dust, waste burning, residential fuel use and power-related emissions also play a role. Pollution transported from surrounding districts can add substantially to what is produced inside the city.
The problem becomes most visible in late autumn and winter, when low wind speeds and temperature inversions trap pollutants. Crop-residue burning in neighbouring regions can worsen some episodes, while fireworks and seasonal weather add further pressure. The IQAir dataset lists Delhi and New Delhi separately, with Delhi occupying the No. 4 global position in the 2025 city ranking.
5. Faisalabad, Pakistan – 98.8 µg/m³
Faisalabad, one of Pakistan’s largest industrial centres, reached an annual PM2.5 average of 98.8 micrograms per cubic metre in 2025. It ranked fifth globally and was the most polluted Pakistani city in the list.
Known for its huge textile and manufacturing base, Faisalabad faces emissions from factories, boilers, brick kilns and heavy road traffic. Scientific studies of the city have identified industrial and vehicle emissions as important sources, with brick kilns adding another substantial combustion source.
Seasonal smog across Punjab makes the situation worse. Crop-residue burning, stagnant winter air and regional pollution can combine with local emissions, allowing fine particles to remain suspended for long periods. As a result, Faisalabad’s pollution is not only an industrial problem but part of a much larger Punjab airshed crisis.
6. Rahim Yar Khan, Pakistan – 92.6 µg/m³
Rahim Yar Khan in Pakistan’s Punjab province ranked sixth with an annual average PM2.5 concentration of 92.6 micrograms per cubic metre.
The city and surrounding district sit in an agricultural and transport corridor where several pollution sources overlap. Road traffic, diesel vehicles, dust, agricultural activity, crop-residue burning and combustion from industrial and brick-making operations can all contribute to poor air quality across Punjab.
Weather can intensify the problem. Dry periods increase dust, while cooler winter conditions reduce atmospheric mixing and allow smoke and fine particles to accumulate. The city’s position in the global Top 10 highlights how Pakistan’s air-pollution crisis extends well beyond Lahore and the country’s best-known metropolitan areas.
7. Ghaziabad, India – 89.2 µg/m³
Ghaziabad, immediately east of Delhi in Uttar Pradesh, recorded an annual PM2.5 average of 89.2 micrograms per cubic metre in 2025.
The city is heavily industrialised and crossed by major transport routes carrying large volumes of cars, buses and freight vehicles. Research on Ghaziabad has identified vehicular and industrial emissions as major contributors to fine particulate pollution, while construction and resuspended road dust are especially important for larger particles.
Its location inside the Delhi-NCR airshed means pollution does not respect municipal boundaries. Emissions from neighbouring areas can move into Ghaziabad just as local pollution can travel elsewhere. Rapid construction, dense traffic and winter stagnation make the city’s air-quality challenge particularly difficult to solve through local measures alone.
8. Lahore, Pakistan – 88.9 µg/m³
Lahore recorded an annual average PM2.5 concentration of 88.9 micrograms per cubic metre in 2025, making it the eighth most polluted city in the world.
The Pakistani megacity has become internationally known for its severe winter smog. Transport emissions, industry, fossil-fuel and biomass combustion, brick kilns, agricultural burning and waste contribute to the regional pollution load. Road dust and rapid urban growth add further pressure.
In winter, cool and stagnant atmospheric conditions can trap those emissions near the surface, producing thick smog and extremely poor visibility. Because Lahore lies within the wider Punjab airshed, pollution can also move across district and national boundaries. Long-term improvement therefore requires action across transport, agriculture, industry, energy and waste management rather than relying on one single source-control measure.
9. Sukkur, Pakistan – 88.6 µg/m³
Sukkur in Sindh province recorded 88.6 micrograms of PM2.5 per cubic metre in 2025, only slightly below Lahore.
Its high ranking is notable because Sukkur is much smaller than the major megacities commonly associated with severe air pollution. The city is an important regional transport and commercial centre, while dry conditions make dust a persistent issue. Vehicle exhaust, fuel combustion, industrial activity and agricultural burning in the wider region can add fine particles to the air.
The result also shows why population size alone is a poor guide to pollution severity. A medium-sized city can experience very high annual exposure when local emissions, regional transport, dry weather and weak pollution controls combine over long periods.
10. Ula, India – 86.8 µg/m³
Ula, also known as Birnagar, in West Bengal recorded an annual average PM2.5 concentration of 86.8 micrograms per cubic metre in 2025 and completed the global Top 10.
Its appearance is important because Ula is not an international megacity. The 2025 ranking therefore demonstrates how dangerous particulate pollution can affect smaller towns as well as famous urban centres. IQAir’s global ranking establishes the high measured concentration, but it does not provide a detailed city-specific source-apportionment study for Ula.
The wider eastern Indo-Gangetic region faces pollution from transport, household and commercial fuel burning, industry, brick kilns, waste burning, agricultural activity and pollution transported from other areas. More local monitoring and source analysis will be important for determining exactly which sources dominate Ula’s exceptionally high annual reading.
Why Are the World’s Most Polluted Cities So Polluted?
The cities in this ranking do not all have the same pollution source. In South Asian cities, traffic, industry, solid-fuel combustion, brick kilns, construction, road dust, crop-residue burning and waste burning often overlap. Pollution can also travel hundreds of kilometres, which means one city’s air may be affected by emissions produced far outside its boundaries.
Weather and geography can make an already serious problem much worse. Cold winter air can trap pollution close to the surface, while dry conditions increase dust. Hotan is an extreme example of natural desert dust combining with urban emissions, while Byrnihat’s terrain can limit dispersion of pollution.
PM2.5 is especially dangerous because the particles are tiny enough to penetrate deep into the lungs and enter the bloodstream. Long-term exposure is associated with increased risks of cardiovascular and respiratory disease, lung cancer and premature death, which is why the WHO recommends an annual average of only 5 micrograms per cubic metre.
Final Word
The 2025 global ranking shows a striking geographic concentration of extreme urban air pollution. All 10 cities are in India, Pakistan or China, and five are in India alone. Loni’s 112.5 micrograms per cubic metre made it the world’s most polluted city for the year, while Hotan, Byrnihat and Delhi also exceeded the WHO annual guideline by around 20 times or more.
The ranking also shows that air pollution is not only a megacity problem. Smaller places such as Loni, Byrnihat, Rahim Yar Khan, Sukkur and Ula can face exposure as serious as, or worse than, much larger cities. Reducing that burden requires cleaner transport and industry, better dust and waste management, cleaner household energy, improved agricultural practices and cooperation across entire regional airsheds.